File:2014 NELP TheLowWageRecovery Figure4.png
Jump to navigation
Jump to search

Size of this preview: 800 × 598 pixels. Other resolution: 989 × 739 pixels.
Original file (989 × 739 pixels, file size: 153 KB, MIME type: image/png)
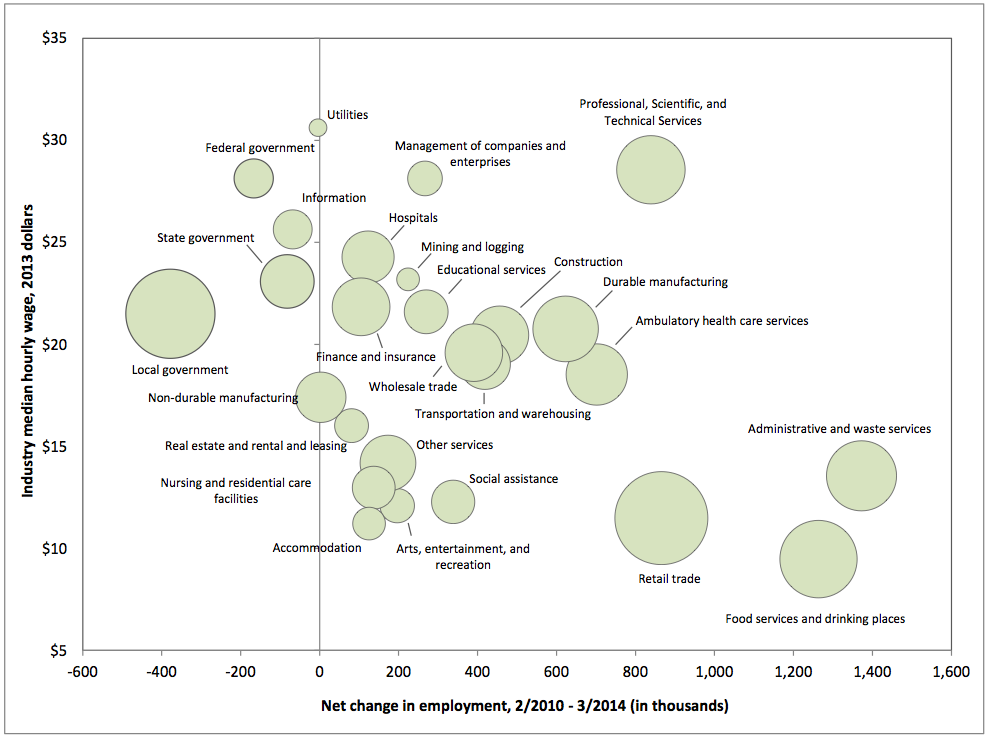
Figure 4. Net Employment Change by Major Industry, February 2010 to March 2014 (Bubble size scaled by industry's current employment) http://www.nelp.org/page/-/Reports/Low-Wage-Recovery-Industry-Employment-Wages-2014-Report.pdf?nocdn=1
File history
Click on a date/time to view the file as it appeared at that time.
| Date/Time | Thumbnail | Dimensions | User | Comment | |
|---|---|---|---|---|---|
| current | 21:43, 2 May 2014 | | 989 × 739 (153 KB) | Gmelli (talk | contribs) | Figure 4. Net Employment Change by Major Industry, February 2010 to March 2014 (Bubble size scaled by industry's current employment) http://www.nelp.org/page/-/Reports/Low-Wage-Recovery-Industry-Employment-Wages-2014-Report.pdf?nocdn=1 |
You cannot overwrite this file.
File usage
The following page uses this file: