Self-Organizing Map
A Self-Organizing Map (SOM) is an artificial neural network that represent a low-dimensional (typically two-dimensional), discretized representation of the input space of the training samples
- AKA: Self-Organizing Feature Map (SOFM), Kohonen Network.
- Context:
- It can be trained by a Self-Organizing Map Algorithm (unsupervised neural network algorithm).
- …
- Example(s):
- Counter-Example(s):
- See: Clustering Algorithm, Unsupervised Learning, Topology, Scientific Visualization, Multidimensional Scaling, Finland, Teuvo Kohonen, Alan Turing, Competitive Learning, Vector Quantization, Hexagonal, Rectangular, Feedforward Neural Networks; Vector Quantization, Hexagonal, Rectangular, Feedforward Neural Networks; Competitive Learning; Dimensionality Reduction; Hebbian Learning; K-means Clustering; Learning Vector Quantization.
References
2018
- (Wikipedia, 2018) ⇒ https://en.wikipedia.org/wiki/Self-organizing_map Retrieved:2018-7-22.
- A self-organizing map (SOM) or self-organizing feature map (SOFM) is a type of artificial neural network (ANN) that is trained using unsupervised learning to produce a low-dimensional (typically two-dimensional), discretized representation of the input space of the training samples, called a map, and is therefore a method to do dimensionality reduction. Self-organizing maps differ from other artificial neural networks as they apply competitive learning as opposed to error-correction learning (such as backpropagation with gradient descent), and in the sense that they use a neighborhood function to preserve the topological properties of the input space.
This makes SOMs useful for visualization by creating low-dimensional views of high-dimensional data, akin to multidimensional scaling. The artificial neural network introduced by the Finnish professor Teuvo Kohonen in the 1980s is sometimes called a Kohonen map or network (Kohonen & Honkela, 2007, Kohonen, 1982). The Kohonen net is a computationally convenient abstraction building on biological models of neural systems from the 1970s and morphogenesis models dating back to Alan Turing in the 1950s. While it is typical to consider this type of network structure as related to feedforward networks where the nodes are visualized as being attached, this type of architecture is fundamentally different in arrangement and motivation. Useful extensions include using toroidal grids where opposite edges are connected and using large numbers of nodes. It has been shown that while self-organizing maps with a small number of nodes behave in a way that is similar to K-means, larger self-organizing maps rearrange data in a way that is fundamentally topological in character. It is also common to use the U-Matrix (Ultsch & Siemon, 1990). The U-Matrix value of a particular node is the average distance between the node's weight vector and that of its closest neighbors (Ultsch, 2003) In a square grid, for instance, we might consider the closest 4 or 8 nodes (the Von Neumann and Moore neighborhoods, respectively), or six nodes in a hexagonal grid.
Large SOMs display emergent properties. In maps consisting of thousands of nodes, it is possible to perform cluster operations on the map itself (Ultsch, 2007).
- A self-organizing map (SOM) or self-organizing feature map (SOFM) is a type of artificial neural network (ANN) that is trained using unsupervised learning to produce a low-dimensional (typically two-dimensional), discretized representation of the input space of the training samples, called a map, and is therefore a method to do dimensionality reduction. Self-organizing maps differ from other artificial neural networks as they apply competitive learning as opposed to error-correction learning (such as backpropagation with gradient descent), and in the sense that they use a neighborhood function to preserve the topological properties of the input space.
2017
- (Samuel Kaski, 2017) ⇒ Samuel Kaski. (2017). "Self-Organizing Maps." In: (Sammut & Webb, 2017). DOI: 10.1007/978-1-4899-7687-1 ISBNs: 978-1-4899-7687-1 (Online), 978-1-4899-7685-7 (Print).
- QUOTE: Self-organizing map (SOM), or Kohonen Map, is a computational data analysis method which produces nonlinear mappings of data to lower dimensions. Alternatively, the SOM can be viewed as a clustering algorithm which produces a set of clusters organized on a regular grid. The roots of SOM are in neural computation (see neural networks); it has been used as an abstract model for the formation of ordered maps of brain functions, such as sensory feature maps. Several variants have been proposed, ranging from dynamic models to Bayesian variants. The SOM has been used widely as an engineering tool for data analysis, process monitoring, and information visualization, in numerous application areas.
2007a
- (Kohonen & Honkela, 2007) ⇒ Teuvo Kohonen, and Timo Honkela. (2007). "Kohonen network." Scholarpedia, 2(1):1568. doi:10.4249/scholarpedia.1568
- QUOTE: The Self-Organizing Map (SOM), commonly also known as Kohonen network (Kohonen 1982, Kohonen 2001) is a computational method for the visualization and analysis of high-dimensional data, especially experimentally acquired information.
(...) The Self-Organizing Map defines an ordered mapping, a kind of projection from a set of given data items onto a regular, usually two-dimensional grid. A model mi is associated with each grid node (Figure 1). These models are computed by the SOM algorithm. A data item will be mapped into the node whose model which is most similar to the data item, e.g., has the smallest distance from the data item in some metric.
Like a codebook vector in vector quantization, the model is then usually a certain weighted local average of the given data items in the data space. But in addition to that, when the models are computed by the SOM algorithm, they are more similar at the nearby nodes than between nodes located farther away from each other on the grid. In this way the set of the models can be regarded to constitute a similarity graph, and structured 'skeleton' of the distribution of the given data items.
The SOM was originally developed for the visualization of distributions of metric vectors, such as ordered sets of measurement values or statistical attributes, but it can be shown that a SOM-type mapping can be defined for any data items, the mutual pairwise distances of which can be defined. Examples of non-vectorial data that are feasible for this method are strings of symbols and sequences of segments in organic molecules (Kohonen and Somervuo 2002).

Figure 1: The array of nodes in a two-dimensional SOM grid.
- QUOTE: The Self-Organizing Map (SOM), commonly also known as Kohonen network (Kohonen 1982, Kohonen 2001) is a computational method for the visualization and analysis of high-dimensional data, especially experimentally acquired information.
2007b
- (Ultsch, 2007) ⇒ Alfred Ultsch (2007). "Emergence in Self-Organizing Feature Maps". In Ritter, H.; Haschke, R. Proceedings of the 6th International Workshop on Self-Organizing Maps (WSOM '07). Bielefeld, Germany: Neuroinformatics Group. ISBN 978-3-00-022473-7.
- QUOTE: We call a SOM Emergent (ESOM), if the definition of watersheds and catchment basins is meaningful on the SOM’s U-Matrix and if the SOM learning algorithm produces a cluster conform, or at least a locally ordered, U-Matrix.
What needs to be shown is that this definition of ESOM fulfills the postulates of Emergence. Catchment basins and/or watersheds are not meaningful concepts for the U-heights of SOM with few neurons. These concepts emerge only when the whole structure of a large U-Matrix is regarded. Think of SOM with 2×2 or 3&time;3 neurons. No really meaningful catchment basin can be defined on those SOM. That a neuron belongs to a certain catchment basin is meaningless for such SOM. The property to be cluster conform is therefore semiotic irreducible (SI). The function which assigns to each neuron the attractor of the catchment basin to which it belongs, is a function which depends on the whole ‘Gestalt” of the U-Matrix. The changing of the U-height of a single neuron, if it is on the watershed between two catchment basins may change the structure of the catchment basins completely. It follows that cluster conformity is systemic. A necessary condition for ESOM, is therefore to consist of enough neurons for a meaningful definition of watersheds and catchment basins. For practical applications, we found 4000 (for example 50×80) neurons to be a good lower limit to show Emergence.(...) If the learning algorithm of an ESOM is topology preserving, it the corresponding U-Matrix is cluster conform. Such a SOM is therefore capable to produce Emergence.
- QUOTE: We call a SOM Emergent (ESOM), if the definition of watersheds and catchment basins is meaningful on the SOM’s U-Matrix and if the SOM learning algorithm produces a cluster conform, or at least a locally ordered, U-Matrix.
2003
- (Ultsch, 2003) ⇒ Alfred Ultsch.(2003); "U*-Matrix: A tool to visualize clusters in high dimensional data", Department of Computer Science, University of Marburg, Technical Report Nr. 36:1-12
- ESOM are a self organizing projection from the high dimensional data space onto a grid of neuron locations. The grid of neurons is usually embedded in a two dimensional manifold. This space is called a map with a geographical interpretation in mind. The learning algorithm of the SOM is designed to preserve the neighborhood relationships of the high dimensional space on the map (Kohonen, 1982). Therefore the map can be regarded as a roadmap of the data space.
(...) The U-Matrix has become the standard tool for the display of the distance structures of the input data on ESOM (Kohonen, 1982).
- ESOM are a self organizing projection from the high dimensional data space onto a grid of neuron locations. The grid of neurons is usually embedded in a two dimensional manifold. This space is called a map with a geographical interpretation in mind. The learning algorithm of the SOM is designed to preserve the neighborhood relationships of the high dimensional space on the map (Kohonen, 1982). Therefore the map can be regarded as a roadmap of the data space.
2001
- (Kohonen, 2001) ⇒ Teuvo Kohonen. (2001). “Self-Organizing Maps, Third Edition." Springer Series in Information Sciences, Vol. 30
- Back cover: Self-Organizing Map (SOM), with its variants, is the most popular artificial neural network algorithm in the unsupervised learning category. About 4000 research articles on it have appeared in the open literature, and many industrial projects use the SOM as a tool for solving hard real-world problems. Many fields of science have adopted the SOM as a standard analytical tool: statistics, signal processing, control theory, financial analysis, experimental physics, chemistry and medicine. The SOM solves difficult high-dimensional and nonlinear problems such as feature extraction and classification of images and acoustic patterns, adaptive control of robots, and equalization, demodulation, and error-tolerant transmission of signals in telecommunications. A new area is the organization of very large document collections. Last but not least, it should be mentioned that the SOM is one of the most realistic models of the biological brain function.
1990
- (Ultsch & Siemon, 1990) ⇒ Alfred Ultsch, and H. Peter Siemon (1990). "Kohonen's Self Organizing Feature Maps for Exploratory Data Analysis". In Widrow, Bernard; Angeniol, Bernard. Proceedings of the International Neural Network Conference (INNC-90), Paris, France, July 9–13, 1990. 1. Dordrecht, Netherlands: Kluwer. pp. 305–308. ISBN 978-0-7923-0831-7.
1982
- (Kohonen, 1982) ⇒ Teuvo Kohonen (1982). "Self-Organized Formation of Topologically Correct Feature Maps" (PDF). Biological Cybernetics. 43 (1): 59–69. doi:10.1007/bf00337288
- QUOTE: Consider Fig. 6, which depicts a one-dimensional array of processing units governed by system equations (1) through (3). In this case each unit except the outermost ones has two nearest neighbours. This system will receive sinusoidal signals and become ordered according to their frequency. Assume a set of resonators or bandpass filters tuned at random to different frequencies. Five inputs to each array unit are now picked up at random from the resonator outputs, so that there is no initial correlation or order in any structure or parameters. Next, we shall carry out a series of adaptation operations, each time generating a new sinusoidal signal with a randomly chosen frequency. After a number of iteration steps the array units start to become sensitized to different frequencies in an ascending or descending order. The results of a few experiments are shown in Table 1.
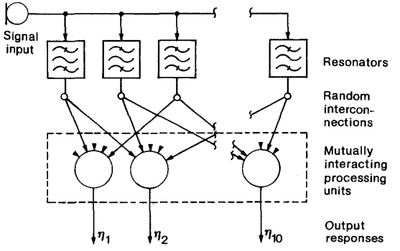
Fig. 6. Illustration of the one-dimensional system used in the selforganized formation of a frequency map.
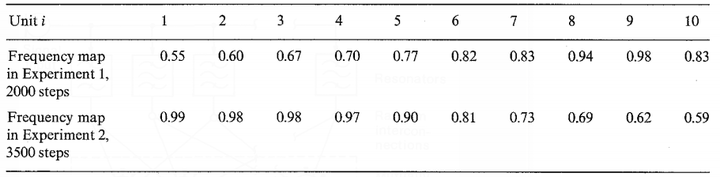 Table 1. Formation of frequency maps in Simulation 4. The resonators (20 in number) corresponded to second-order filters with quality factor Q=2.5 and resonant frequencies selected at random from the range [1,2]. The training frequencies were selected at random from the range [0.5; 1]. This table shows two different ordering results. The numbers in the table indicate those test frequencies to which each processing unit became most sensitive.
- QUOTE: Consider Fig. 6, which depicts a one-dimensional array of processing units governed by system equations (1) through (3). In this case each unit except the outermost ones has two nearest neighbours. This system will receive sinusoidal signals and become ordered according to their frequency. Assume a set of resonators or bandpass filters tuned at random to different frequencies. Five inputs to each array unit are now picked up at random from the resonator outputs, so that there is no initial correlation or order in any structure or parameters. Next, we shall carry out a series of adaptation operations, each time generating a new sinusoidal signal with a randomly chosen frequency. After a number of iteration steps the array units start to become sensitized to different frequencies in an ascending or descending order. The results of a few experiments are shown in Table 1.


1973
- (Von der Malsburg, 1973) ⇒ Chr. Von der Malsburg (1973). "Self-organization of orientation sensitive cells in the striate cortex".(PDF) Kybernetik. 14: 85–100. doi:10.1007/bf00288907.
- QUOTE: The model consists of a network of cells. The information transmitting signal is thought to be the discharge rate of the cells, averaged over a small interval of time. Thus the signal we employ here is a smooth function of time. This avoids the problem of artificial pulse - synchronization caused by the quantization of time, which is necessary in computer simulations. The cells make contact via connections (synapses). The connections can differ in weight, and are characterized by a number called strength of connection. The strength of connection from a cell A to a cell B will be denoted by PAB. This term would include excitatory effects such as the sum of the post-synaptic potentials caused in a cell B by all the synapses of cell A on the dendrites and cell body of B. No assumptions are being made about the morphological variables which might determine the strength of connection. It may be different effectiveness or position of single synapses or merely a variable number of synapses between cells A and B (probably both). There are excitatory (E) and inhibitory (I) cells which have positive and negative strengths of connection respectively.
(...) The wiring of the network is explained in Fig. 4: Each active E-cell directly excites the immediately neighbouring E-cells with strength p and the immediately neighbouring I-cells (including the one occupying the same place as the active ceil) with strength r. Each active I-cell inhibits with strength q its next-to-immediate neighbours amongst the E-cells only.
Fig. 4. A small part of the simulated cortex, showing the hexagonal array of the E-cells (upper plane) and the I-cells (lower plane). The different symbols are used to designate those cells which are connected with strengths, p, r and q. Every cell is connected with its neighbors in the same way (except at the borders).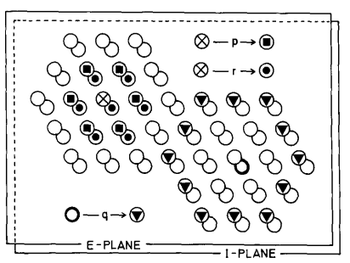
----
- QUOTE: The model consists of a network of cells. The information transmitting signal is thought to be the discharge rate of the cells, averaged over a small interval of time. Thus the signal we employ here is a smooth function of time. This avoids the problem of artificial pulse - synchronization caused by the quantization of time, which is necessary in computer simulations. The cells make contact via connections (synapses). The connections can differ in weight, and are characterized by a number called strength of connection. The strength of connection from a cell A to a cell B will be denoted by PAB. This term would include excitatory effects such as the sum of the post-synaptic potentials caused in a cell B by all the synapses of cell A on the dendrites and cell body of B. No assumptions are being made about the morphological variables which might determine the strength of connection. It may be different effectiveness or position of single synapses or merely a variable number of synapses between cells A and B (probably both). There are excitatory (E) and inhibitory (I) cells which have positive and negative strengths of connection respectively.
