Charles Joseph Minard's 1869 Flow Map of the War of 1812
Jump to navigation
Jump to search
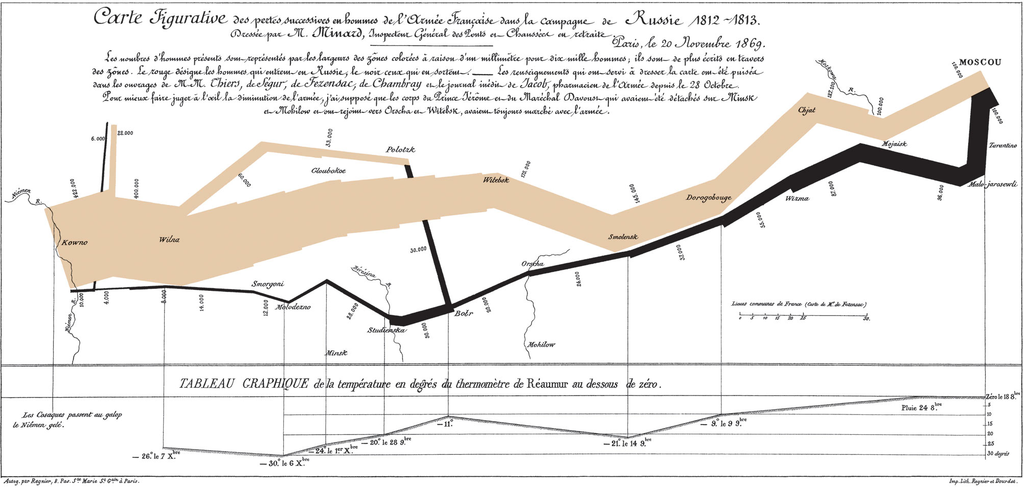
A Charles Joseph Minard's 1869 Flow Map of the War of 1812 is a timeseries infographic that visualizes Napoleon's Russian campaign through innovative flow visualization techniques.
- AKA: Minard's Map, Napoleon's March to Moscow (Minard), 1869 Flow Map of Napoleon's Russian Campaign.
- Context:
- It can represent Troop Movement through flow width visualization.
- It can display Army Size through proportional line thickness.
- It can integrate Temperature Data with geographic position.
- It can combine Multiple Data Types through synchronized visualization.
- It can encode Campaign Timeline through directional flow indication.
- It can illustrate Geographic Context through simplified terrain representation.
- ...
- It can range from being a Statistical Diagram to being a Narrative Visualization, depending on its interpretation context.
- It can range from being a Historical Document to being a Data Visualization Pioneer, depending on its usage context.
- ...
- It can demonstrate Visual Complexity through multivariate representation.
- It can achieve Data Density through layered information design.
- It can maintain Visual Clarity through effective visual hierarchy.
- ...
- Examples:
- Key Visual Elements, such as:
- Flow Lines, such as:
- Advance Path showing troop movement toward moscow.
- Retreat Path showing return journey losses.
- Data Encodings, such as:
- Line Width representing army size variation.
- Temperature Graph showing weather conditions.
- Flow Lines, such as:
- Historical Impacts, such as:
- Data Visualization Innovations, such as:
- Multivariate Display combining geographic and quantitative data.
- Flow Representation showing movement and quantity.
- Data Visualization Innovations, such as:
- ...
- Key Visual Elements, such as:
- Counter-Examples:
- Traditional Battle Maps, which lack quantitative flow representation.
- Simple Flow Diagrams, which lack geographic context integration.
- Temperature Graphs, which lack movement visualization.
- See: Flow Map, Statistical Visualization, Historical Data Visualization, Information Graphics.