Principal Components Analysis (PCA) Task
A Principal Components Analysis (PCA) Task is a matrix decomposition task that requires the discovery of [math]\displaystyle{ d }[/math] principal components (such that they are ranked from most to least possible variance).
- Context:
- Input: [math]\displaystyle{ d }[/math] number of Principal Components.
- output: Principal Components, such as: a First Principal Component or a Second Principal Component.
- It can (typically) be a Linear PCA Task (or be a non-linear PCA task, such as: Bell & Sejnowski, 1995)
- It can be solved by a PCA System (that implements a PCA algorithm).
- It can support a Numerical Data Compression Task (such as feature compression).
- Example(s):
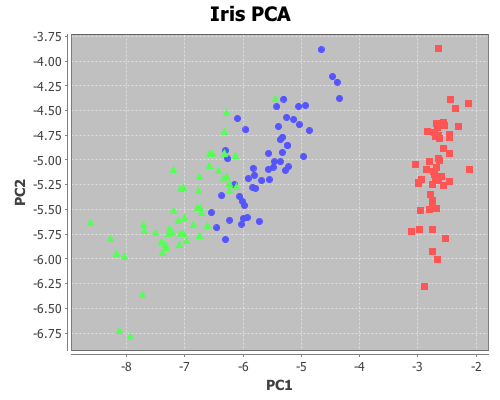
PCA(Iris dataset, 3)
- Counter-Example(s):
- See: Orthogonal Transformation, Linear Modeling, Dimensionality Compression, Linearly Uncorrelated Variable.
References
2019
- (Wikipedia, 2019) ⇒ https://en.wikipedia.org/wiki/Principal_component_analysis Retrieved:2019-10-14.
- Principal component analysis (PCA) is a statistical procedure that uses an orthogonal transformation to convert a set of observations of possibly correlated variables (entities each of which takes on various numerical values) into a set of values of linearly uncorrelated variables called principal components. This transformation is defined in such a way that the first principal component has the largest possible variance (that is, accounts for as much of the variability in the data as possible), and each succeeding component in turn has the highest variance possible under the constraint that it is orthogonal to the preceding components. The resulting vectors (each being a linear combination of the variables and containing n observations) are an uncorrelated orthogonal basis set. PCA is sensitive to the relative scaling of the original variables.
PCA was invented in 1901 by Karl Pearson, as an analogue of the principal axis theorem in mechanics; it was later independently developed and named by Harold Hotelling in the 1930s. [1] Depending on the field of application, it is also named the discrete Karhunen–Loève transform (KLT) in signal processing, the Hotelling transform in multivariate quality control, proper orthogonal decomposition (POD) in mechanical engineering, singular value decomposition (SVD) of X (Golub and Van Loan, 1983), eigenvalue decomposition (EVD) of XTX in linear algebra, factor analysis (for a discussion of the differences between PCA and factor analysis see Ch. 7 of Jolliffe's Principal Component Analysis),[2] Eckart–Young theorem (Harman, 1960), or empirical orthogonal functions (EOF) in meteorological science, empirical eigenfunction decomposition (Sirovich, 1987), empirical component analysis (Lorenz, 1956), quasiharmonic modes (Brooks et al., 1988), spectral decomposition in noise and vibration, and empirical modal analysis in structural dynamics. PCA is mostly used as a tool in exploratory data analysis and for making predictive models. It is often used to visualize genetic distance and relatedness between populations. PCA can be done by eigenvalue decomposition of a data covariance (or correlation) matrix or singular value decomposition of a data matrix, usually after a normalization step of the initial data. The normalization of each attribute consists of mean centering – subtracting each data value from its variable's measured mean so that its empirical mean (average) is zero – and, possibly, normalizing each variable's variance to make it equal to 1; see Z-scores. The results of a PCA are usually discussed in terms of component scores, sometimes called factor scores (the transformed variable values corresponding to a particular data point), and loadings (the weight by which each standardized original variable should be multiplied to get the component score). [3] If component scores are standardized to unit variance, loadings must contain the data variance in them (and that is the magnitude of eigenvalues). If component scores are not standardized (therefore they contain the data variance) then loadings must be unit-scaled, ("normalized") and these weights are called eigenvectors; they are the cosines of orthogonal rotation of variables into principal components or back. PCA is the simplest of the true eigenvector-based multivariate analyses. Often, its operation can be thought of as revealing the internal structure of the data in a way that best explains the variance in the data. If a multivariate dataset is visualised as a set of coordinates in a high-dimensional data space (1 axis per variable), PCA can supply the user with a lower-dimensional picture, a projection of this object when viewed from its most informative viewpoint. This is done by using only the first few principal components so that the dimensionality of the transformed data is reduced. PCA is closely related to factor analysis. Factor analysis typically incorporates more domain specific assumptions about the underlying structure and solves eigenvectors of a slightly different matrix. PCA is also related to canonical correlation analysis (CCA). CCA defines coordinate systems that optimally describe the cross-covariance between two datasets while PCA defines a new orthogonal coordinate system that optimally describes variance in a single dataset.
- Principal component analysis (PCA) is a statistical procedure that uses an orthogonal transformation to convert a set of observations of possibly correlated variables (entities each of which takes on various numerical values) into a set of values of linearly uncorrelated variables called principal components. This transformation is defined in such a way that the first principal component has the largest possible variance (that is, accounts for as much of the variability in the data as possible), and each succeeding component in turn has the highest variance possible under the constraint that it is orthogonal to the preceding components. The resulting vectors (each being a linear combination of the variables and containing n observations) are an uncorrelated orthogonal basis set. PCA is sensitive to the relative scaling of the original variables.
2014
- Sebastian Rashka. (2014). “Implementing a Principal Component Analysis (PCA) in Python step by step." Blog post
- QUOTE: Both Multiple Discriminant Analysis (MDA) and Principal Component Analysis (PCA) are linear transformation methods and closely related to each other. In PCA, we are interested to find the directions (components) that maximize the variance in our dataset, where in MDA, we are additionally interested to find the directions that maximize the separation (or discrimination) between different classes (for example, in pattern classification problems where our dataset consists of multiple classes. In contrast two PCA, which ignores the class labels). In other words, via PCA, we are projecting the entire set of data (without class labels) onto a different subspace, and in MDA, we are trying to determine a suitable subspace to distinguish between patterns that belong to different classes. Or, roughly speaking in PCA we are trying to find the axes with maximum variances where the data is most spread (within a class, since PCA treats the whole data set as one class), and in MDA we are additionally maximizing the spread between classes. In typical pattern recognition problems, a PCA is often followed by an MDA.
2011
- (Sammut & Webb, 2011) ⇒ Claude Sammut, and Geoffrey I. Webb. (2011). “Principal Component Analysis.” In: (Sammut & Webb, 2011) p.795
- QUOTE: ... Principal Component Analysis (PCA) is a dimensionality reduction technique. It is described in covariance matrix. ...
2009a
- http://www.statistics.com/resources/glossary/p/pca.php
- QUOTE: The purpose of principal component analysis is to derive a small number of linear combinations (principal components) of a set of variables that retain as much of the information in the original variables as possible. This technique is often used when there are large numbers of variables, and you wish to reduce them to a smaller number of variable combinations by combining similar variables (ones that contain much the same information).
Principal components are linear combinations of variables that retain maximal amount of information about the variables. The term "maximal amount of information" here means the best least-square fit, or, in other words, maximal ability to explain variance of the original data.
In technical terms, a principal component for a given set of N-dimensional data, is a linear combination of the original variables with coefficients equal to the components of an eigenvector of the correlation or covariance matrix. Principal components are usually sorted by descending order of the eigenvalues - i.e. the first principal component corresponds to the eigenvector with the maximal eigenvalue.
- QUOTE: The purpose of principal component analysis is to derive a small number of linear combinations (principal components) of a set of variables that retain as much of the information in the original variables as possible. This technique is often used when there are large numbers of variables, and you wish to reduce them to a smaller number of variable combinations by combining similar variables (ones that contain much the same information).
2009b
- (Johnstone & Lu, 2009) ⇒ Iain M Johnstone, and Arthur Yu Lu. (2009). “On Consistency and Sparsity for Principal Components Analysis in High Dimensions." doi:10.1198/jasa.2009.0121
- QUOTE: Suppose [math]\displaystyle{ {x_i, i=1,…,n} }[/math] is a dataset of [math]\displaystyle{ n }[/math] observations on [math]\displaystyle{ p }[/math] variables. Standard principal components analysis (PCA) looks for vectors ξ that maximize :[math]\displaystyle{ var(ξTxℓ.)/∥ξ∥2. (1) }[/math] If [math]\displaystyle{ ξ_1, …, ξ_k }[/math] have already been found by this optimization, then the maximum defining <math>ξ_{k+1}<math> is taken over vectors ξ orthogonal to <math>ξ1, …, ξk<math>.
2006
- (Hinton & Salakhutdinov, 2006) ⇒ Geoffrey E. Hinton, and Ruslan R. Salakhutdinov. (2006). “Reducing the Dimensionality of Data with Neural Networks.” In: Science, 313(5786). doi:10.1126/science.1127647
- QUOTE: … A simple and widely used method is principal components analysis (PCA), which finds the directions of greatest variance in the data set and represents each data point by its coordinates along each of these directions. We describe a nonlinear generalization of PCA that uses an adaptive, multilayer "encoder" network.
2002a
- (Jollife, 2002) ⇒ Ian T. Jolliffe. (2002). “Principal Component Analysis, 2nd ed." Springer. ISBN:0-387-95442-2
- QUOTE: Principal component analysis is central to the study of multivariate data. Although one of the earliest multivariate techniques it continues to be the subject of much research, ranging from new model-based approaches to algorithmic ideas from neural networks. It is extremely versatile with applications in many disciplines. …
2002b
- (Fodor, 2002) ⇒ Imola K. Fodor. (2002). “A Survey of Dimension Reduction Techniques." LLNL technical report, UCRL ID-148494
- QUOTE: Principal component analysis (PCA) is the best, in the mean-square error sense, linear dimension reduction technique [25, 28]. Being based on the covariance matrix of the variables, it is a second-order method. In various fields, it is also known as the singular value decomposition (SVD), the Karhunen-Loµeve transform, the Hotelling transform, and the empirical orthogonal function (EOF) method.
In essence, PCA seeks to reduce the dimension of the data by finding a few orthogonal linear combinations (the PCs) of the original variables with the largest variance. The first PC, s1, is the linear combination with the largest variance.
- QUOTE: Principal component analysis (PCA) is the best, in the mean-square error sense, linear dimension reduction technique [25, 28]. Being based on the covariance matrix of the variables, it is a second-order method. In various fields, it is also known as the singular value decomposition (SVD), the Karhunen-Loµeve transform, the Hotelling transform, and the empirical orthogonal function (EOF) method.
1999
- (Tipping & Bishop, 1999) ⇒ Michael E. Tipping, and Christopher M. Bishop. (1999). “Probabilistic Principal Component Analysis.” In: Journal of the Royal Statistical Society, 61(3).
1995
- (Bell & Sejnowski, 1995) ⇒ Anthony J. Bell, and Terrence J. Sejnowski. (1995). “An Information-maximization Approach to Blind Separation and Blind Deconvolution.” Neural computation 7, no. 6
- QUOTE: ... A class of nonlinear PCA (principal component analysis) type learning algorithms is derived by minimizing a general statistical signal representation error. Another related algorithm is derived from a nonlinear feature extraction criterion. Several known algorithms emerge as …
1901
- (Pearson, 1901) ⇒ Karl Pearson. (1901). “On Lines and Planes of Closest Fit to Systems of Points in Space" In: Philosophical Magazine, 2(11). doi:10.1080/14786440109462720.
- ↑ Hotelling, H. (1933). Analysis of a complex of statistical variables into principal components. Journal of Educational Psychology, 24, 417–441, and 498–520.
- ↑ Jolliffe I.T. Principal Component Analysis, Series: Springer Series in Statistics, 2nd ed., Springer, NY, 2002, XXIX, 487 p. 28 illus.
- ↑ Shaw P.J.A. (2003) Multivariate statistics for the Environmental Sciences, Hodder-Arnold. .