Receiver Operating Characteristic (ROC) Curve
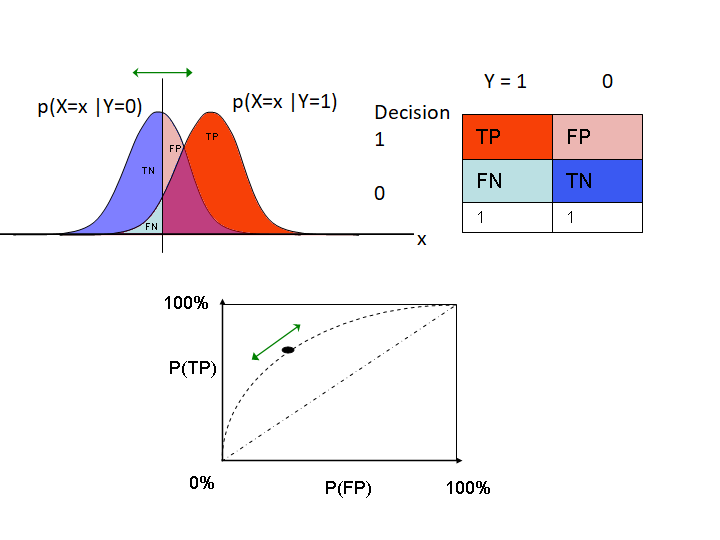
A Receiver Operating Characteristic (ROC) Curve is a graphical plot of an ROC function within an ROC space (which illustrates the performance of a binary classifier system as its discrimination threshold is varied)
- Context:
- It can be an input to an AUC Measure (for ROC analysis).
- Example(s):
- File:AUC.150719.xlsx.
- a Multi-Model ROC Curve, such as:


- Counter-Example(s):
- See: ROC Convex Hull, Signal Detection Theory, Graph of a Function, Binary Classifier, True Positive, False Positive, Sensitivity (Tests), Classification Accuracy, Binary Classifier Performance Metric, F1 Metric, AUC, MAP.
References
2015
- (Wikipedia, 2015) ⇒ http://en.wikipedia.org/wiki/Receiver_operating_characteristic Retrieved:2015-7-18.
- In statistics, a receiver operating characteristic (ROC), or ROC curve, is a graphical plot that illustrates the performance of a binary classifier system as its discrimination threshold is varied. The curve is created by plotting the true positive rate against the false positive rate at various threshold settings. The true-positive rate is also known as sensitivity or the sensitivity index d', known as "d-prime" in signal detection and biomedical informatics, or recall in machine learning. The false-positive rate is also known as the fall-out and can be calculated as (1 - specificity). The ROC curve is thus the sensitivity as a function of fall-out. In general, if the probability distributions for both detection and false alarm are known, the ROC curve can be generated by plotting the cumulative distribution function (area under the probability distribution from [math]\displaystyle{ -\infty }[/math] to [math]\displaystyle{ +\infty }[/math] ) of the detection probability in the y-axis versus the cumulative distribution function of the false-alarm probability in x-axis.
ROC analysis provides tools to select possibly optimal models and to discard suboptimal ones independently from (and prior to specifying) the cost context or the class distribution. ROC analysis is related in a direct and natural way to cost/benefit analysis of diagnostic decision making.
The ROC curve was first developed by electrical engineers and radar engineers during World War II for detecting enemy objects in battlefields and was soon introduced to psychology to account for perceptual detection of stimuli. ROC analysis since then has been used in medicine, radiology, biometrics, and other areas for many decades and is increasingly used in machine learning and data mining research.
The ROC is also known as a relative operating characteristic curve, because it is a comparison of two operating characteristics (TPR and FPR) as the criterion changes.[1]
- In statistics, a receiver operating characteristic (ROC), or ROC curve, is a graphical plot that illustrates the performance of a binary classifier system as its discrimination threshold is varied. The curve is created by plotting the true positive rate against the false positive rate at various threshold settings. The true-positive rate is also known as sensitivity or the sensitivity index d', known as "d-prime" in signal detection and biomedical informatics, or recall in machine learning. The false-positive rate is also known as the fall-out and can be calculated as (1 - specificity). The ROC curve is thus the sensitivity as a function of fall-out. In general, if the probability distributions for both detection and false alarm are known, the ROC curve can be generated by plotting the cumulative distribution function (area under the probability distribution from [math]\displaystyle{ -\infty }[/math] to [math]\displaystyle{ +\infty }[/math] ) of the detection probability in the y-axis versus the cumulative distribution function of the false-alarm probability in x-axis.
- ↑ Swets, John A.; Signal detection theory and ROC analysis in psychology and diagnostics : collected papers, Lawrence Erlbaum Associates, Mahwah, NJ, 1996
2014a
- (Cai et al., 2014) ⇒ Hongmin Cai, Lizhi Liu, Yanxia Peng, Yaopan Wu, and Li Li. (2014). “Diagnostic Assessment by Dynamic Contrast-enhanced and Diffusion-weighted Magnetic Resonance in Differentiation of Breast Lesions under Different Imaging Protocols.” BMC cancer 14, no. 1
- QUOTE:

- QUOTE:
2014b
- "2014-2015 NBA Season Prediction."
- QUOTE: I spent few days creating a machine learning model to make predictions of 2014-2015 NBA season. ...

- QUOTE: I spent few days creating a machine learning model to make predictions of 2014-2015 NBA season. ...
2011
- (Sammut & Webb, 2011) ⇒ Claude Sammut, and Geoffrey I. Webb. (2011). “ROC Curve].” In: (Sammut & Webb, 2011) p.875
- QUOTE: The ROC curve is a plot depicting the trade-off between the true positive rate and the false positive rate for a classifier under varying decision thresholds. See ROC Analysis.
2006
- (Fawcett, 2006) ⇒ Tom Fawcett. (2006). “An Introduction to ROC Analysis.” In: Pattern Recognition Letters, 27(8). doi:10.1016/j.patrec.2005.10.010
- QUOTE: Receiver operating characteristics (ROC) graphs are useful for organizing classifiers and visualizing their performance. ROC graphs are commonly used in medical decision making, and in recent years have been used increasingly in machine learning and data mining research. Although ROC graphs are apparently simple, there are some common misconceptions and pitfalls when using them in practice. The purpose of this article is to serve as an introduction to ROC graphs and as a guide for using them in research.
2006b
- (Davis & Goadrich, 2006) ⇒ Jesse Davis, and Mark Goadrich. (2006). “The Relationship Between Precision-Recall and ROC Curves.” In: Proceedings of the 23rd International Conference on Machine learning. ISBN:1-59593-383-2 doi:10.1145/1143844.1143874
- QUOTE: Receiver Operator Characteristic (ROC) curves are commonly used to present results for binary decision problems in machine learning. However, when dealing with highly skewed datasets, Precision-Recall (PR) curves give a more informative picture of an algorithm's performance. We show that a deep connection exists between ROC space and PR space, such that a curve dominates in ROC space if and only if it dominates in PR space.
2005
- (Flach & Wu, 2005) ⇒ Peter A. Flach, and Shaomin Wu. (2005). “Repairing Concavities in ROC Curves.” In: Proceedings of the 19th international joint conference on Artificial intelligence.
- QUOTE: Assume that the confusion matrix of a classifier evaluated on a test set is as in Table 1. Then the true positive rate of the classifier is [math]\displaystyle{ a / (a + b) }[/math] and the false positive rate of the classifier is [math]\displaystyle{ c / (c + d) }[/math]. The point [math]\displaystyle{ (c / (c +]] d),a / (a + b)) }[/math] in the XY plane (i.e., ROC space) will be used to represent the performance of this classifier. If a model is under the ascending diagonal in ROC space, this means that it performs worse than random. Models A and B in Figure 1 are such worse-than-random models. However, there is a very useful trick to obtain better-than random models: simply invert all predictions of the original model. This corresponds to exchanging the columns in the contingency table, leading to a new true positive rate of [math]\displaystyle{ b / (a + b) = 1-a / (a + b) }[/math], i.e. one minus the original true positive rate; similarly we obtain a new false positive rate of [math]\displaystyle{ d / (c + d) = 1-c / (c + d) }[/math]. Geometrically, this corresponds to mirroring the original ROC point through the midpoint on the ascending diagonal.