Venn Diagram
Jump to navigation
Jump to search
A Venn Diagram is a diagram that ...
References
2016
- (Wikipedia, 2016) ⇒ https://en.wikipedia.org/wiki/venn_diagram Retrieved:2016-9-27.
- A Venn diagram (also called a set diagram or logic diagram) is a diagram that shows all possible logical relations between a finite collection of different sets. Typically overlapping shapes, usually circles, are used, and an area-proportional or scaled Venn diagram is one in which the area of the shape is proportional to the number of elements it contains.
These diagrams represent elements as points in the plane, and sets as regions inside curves.
An element is in a set S just in case the corresponding point is in the region for S.
They are thus a special case of Euler diagrams, which do not necessarily show all relations. Venn diagrams were conceived around 1880 by John Venn. They are used to teach elementary set theory, as well as illustrate simple set relationships in probability, logic, statistics, linguistics and computer science.
- A Venn diagram (also called a set diagram or logic diagram) is a diagram that shows all possible logical relations between a finite collection of different sets. Typically overlapping shapes, usually circles, are used, and an area-proportional or scaled Venn diagram is one in which the area of the shape is proportional to the number of elements it contains.
2014
- http://www.thefirstscience.org/syllogistic-machine/notes-on-syllogistic-logic/
- QUOTE: Figure 2 Venn diagrams for the four terms of Aristotle
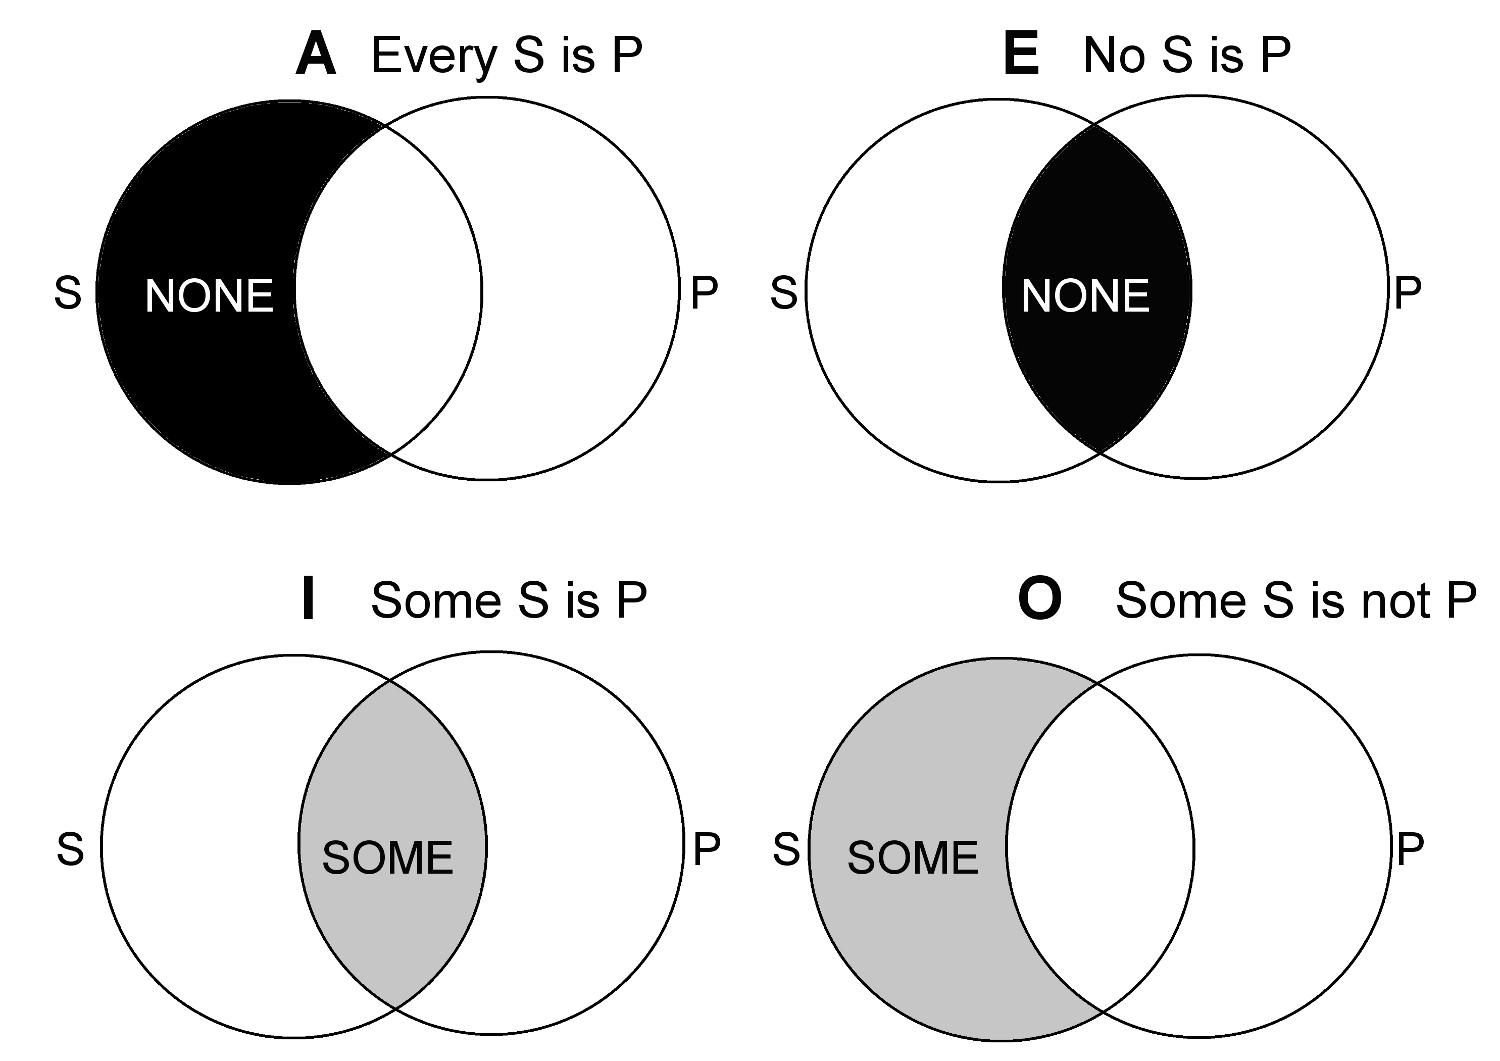
- QUOTE: Figure 2 Venn diagrams for the four terms of Aristotle
