File:Smith 2017 Fig2.png
Jump to navigation
Jump to search

No higher resolution available.
Smith_2017_Fig2.png (480 × 285 pixels, file size: 37 KB, MIME type: image/png)
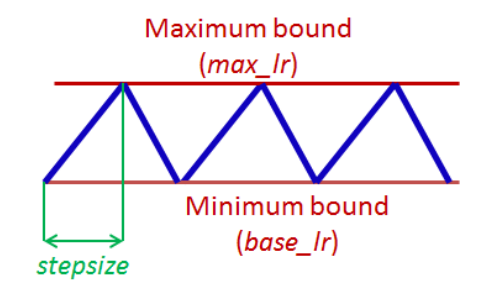
Figure 2. Triangular learning rate policy. The blue lines represent learning rate values changing between bounds. The input parameter stepsize is the number of iterations in half a cycle. In: Leslie N. Smith (2017, March). "Cyclical learning rates for training neural networks" (PDF). In Applications of Computer Vision (WACV), 2017 IEEE Winter Conference on (pp. 464-472). IEEE. arXiv:1506.01186
File history
Click on a date/time to view the file as it appeared at that time.
| Date/Time | Thumbnail | Dimensions | User | Comment | |
|---|---|---|---|---|---|
| current | 04:36, 20 October 2018 | | 480 × 285 (37 KB) | Omoreira (talk | contribs) | Figure 2. Triangular learning rate policy. The blue lines represent learning rate values changing between bounds. The input parameter stepsize is the number of iterations in half a cycle. In: Leslie N. Smith (2017, March). [http... |
You cannot overwrite this file.
File usage
The following page uses this file: