File list
Jump to navigation
Jump to search
This special page shows all uploaded files.
| Date | Name | Thumbnail | Size | User | Description | Versions |
|---|---|---|---|---|---|---|
| 14:11, 31 July 2014 | Randazzo,2009 StoneFields07.jpg (file) |  |
197 KB | Gmelli | by visual artist Giuseppe Randazzo from http://www.novastructura.net/wp/wp-content/uploads/2013/07/StoneFields07-LinearPolar-novastructura.net-G.Randazzo-2009.jpg | 1 |
| 22:02, 26 July 2014 | 2007 P NP NP-Complete NP-Hard.png (file) |  |
26 KB | Gmelli | from http://commons.wikimedia.org/wiki/File:P_np_np-complete_np-hard.svg | 1 |
| 21:33, 18 May 2014 | TextGraph Melli2010b Figure7.gif (file) |  |
20 KB | Gmelli | A sample of the text graph representation (for a highly summarized document) that SDOI_RMI would use to create feature vectors for the task of relation mention identification. (Melli, 2010b) Figure 7 | 1 |
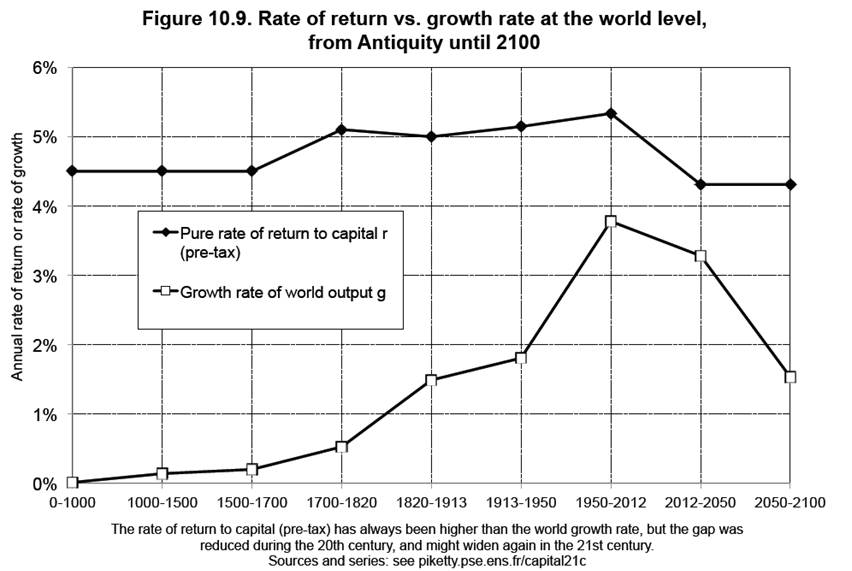
| 18:53, 6 May 2014 | 2014 CapitalintheTwentyFirstCentury F10.9.jpg (file) |  |
60 KB | Gmelli | FIGURE 10.9. Rate of return versus growth rate at the [[world level], from Antiquity until 2100 The rate of return to capital (pretax) has always been higher than the [[world economic growth rate|world growth ra... | 1 |
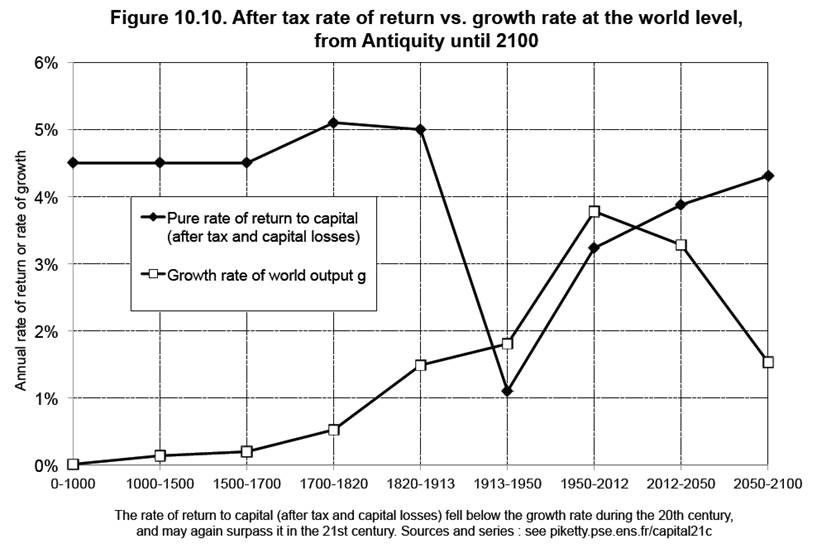
| 18:48, 6 May 2014 | 2014 CapitalintheTwentyFirstCentury F10.10.jpg (file) |  |
57 KB | Gmelli | Figure 10.10. After tax rate of return vs. growth rate at the world level, from Antiquity until 2100 (Piketty, 2014) Source: http://piketty.pse.ens.fr/files/capital21... | 1 |
| 17:32, 6 May 2014 | 2014 CapitalintheTwentyFirstCentury F10.10.gif (file) |  |
13 KB | Gmelli | Figure 10.10. After tax rate of return vs. growth rate at the world level, from Antiquity until 2100 (Piketty, 2014) Source: http://piketty.pse.ens.fr/files/capital21c/en/pdf/F10.10.pdf | 1 |
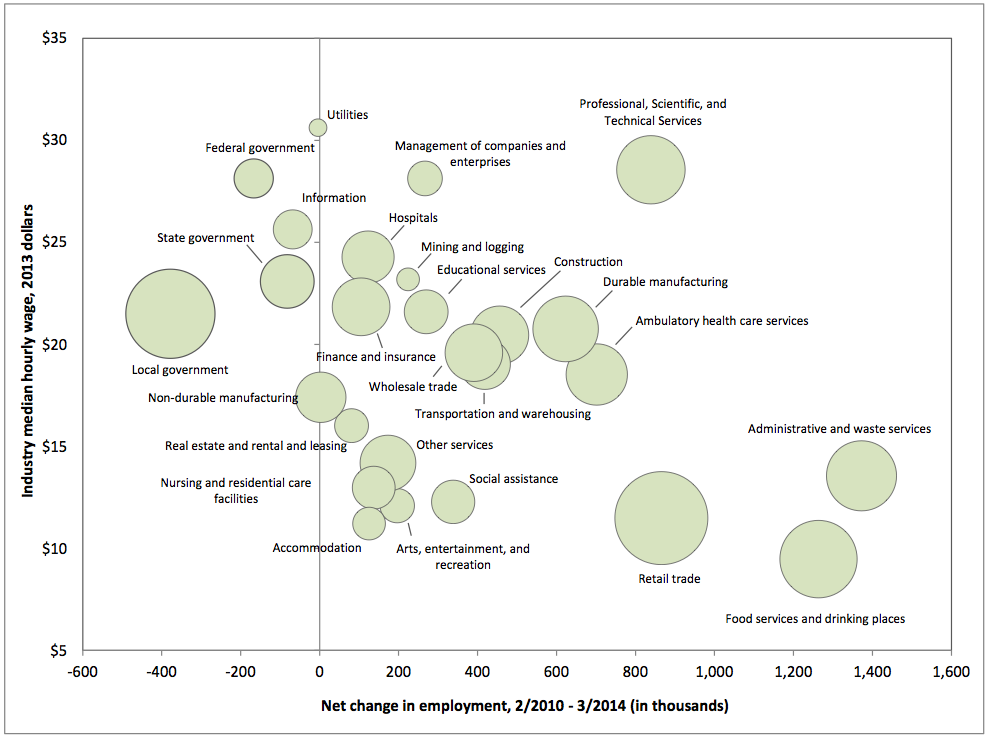
| 21:43, 2 May 2014 | 2014 NELP TheLowWageRecovery Figure4.png (file) |  |
153 KB | Gmelli | Figure 4. Net Employment Change by Major Industry, February 2010 to March 2014 (Bubble size scaled by industry's current employment) http://www.nelp.org/page/-/Reports/Low-Wage-Recovery-Industry-Employment-Wages-2014-Report.pdf?nocdn=1 | 1 |
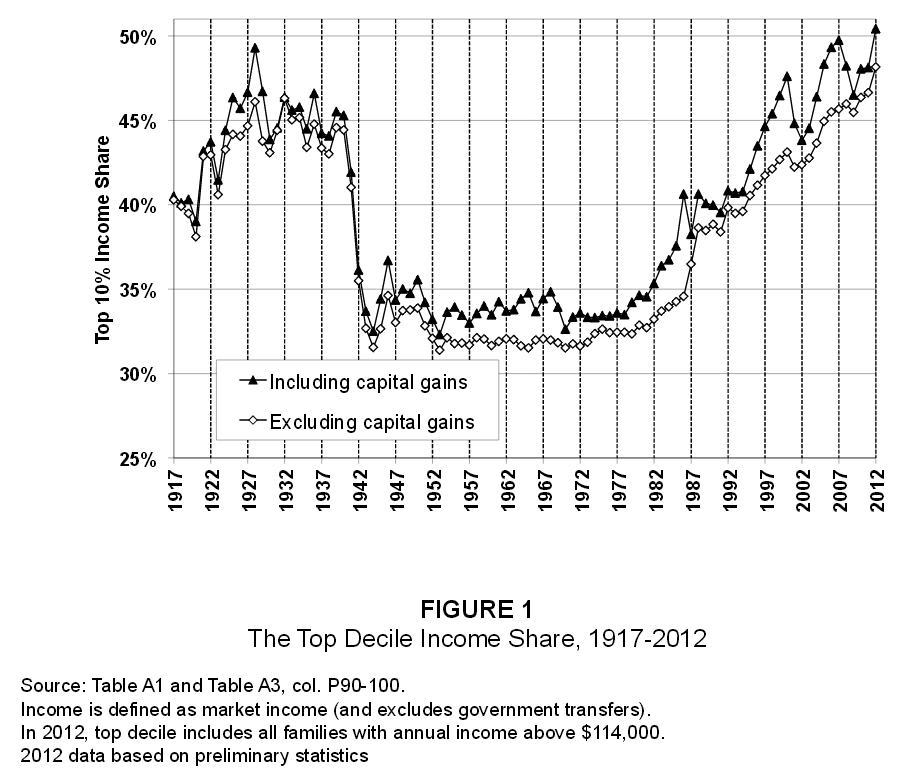
| 18:52, 17 April 2014 | 2013 StrikingItRicherTheEvolutionofT Figure1.jpg (file) |  |
0 bytes | Gmelli | Figure 1. in (Saez, 2013) | 1 |
| 21:08, 1 March 2014 | US Unemployment 1890-2009.gif (file) |  |
24 KB | Gmelli | https://upload.wikimedia.org/wikipedia/commons/9/9c/US_Unemployment_1890-2009.gif | 1 |
| 03:31, 5 December 2013 | AmazonMechTurk-forProductTermAnnotation.131113.pptx (file) | 3.7 MB | Gmelli | Presentation on how to use Amazon Mechanical Turk for annotating producty terms. | 1 | |
| 20:40, 14 October 2013 | CPROD1overview.121015.pdf (file) | 196 KB | Gmelli | (Melli & Romming, 2012) ⇒ Gabor Melli, and Christian Romming. (2012). "An Overview of the CPROD1 Contest on Consumer Product Recognition within User Generated Postings and Normalization against a Large Product Catalog." In: Proceedings of the ICDM-20... | 1 | |
| 22:40, 24 July 2013 | RegressionTrees GM-RKB 120724.pptx (file) | 1.73 MB | Gmelli | simple presentation illustrating some basic regression tree induction concepts | 1 | |
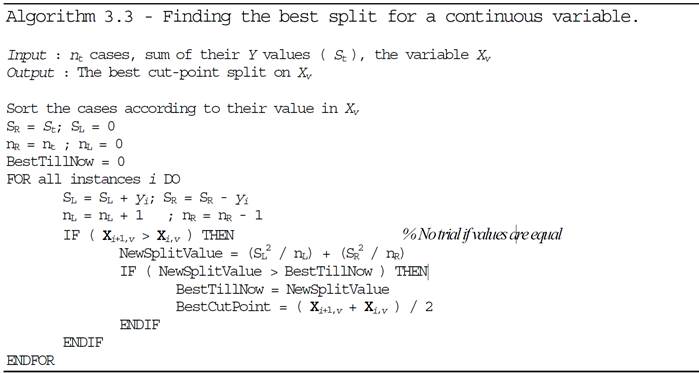
| 16:12, 24 July 2013 | 1999 InductiveLearningofTreebasedReg Algorithm3.3.jpg (file) |  |
32 KB | Gmelli | * (Torgo, 1999) ⇒ Luis Torgo. (1999). "[http://www.dcc.fc.up.pt/~ltorgo/PhD/ Inductive Learning of Tree-based Regression Models]." Ph.D. Thesis, Thesis, Faculty of Sciences, University of Porto htt... | 1 |
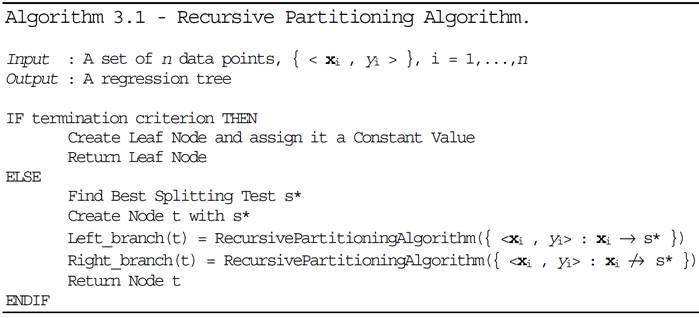
| 16:11, 24 July 2013 | 1999 InductiveLearningofTreebasedReg Algorithm3.1.jpg (file) |  |
33 KB | Gmelli | http://www.dcc.fc.up.pt/~ltorgo/PhD/th3.pdf Regression trees are constructed using a recursive partitioning (RP) algorithm. This algorithm builds a tree by recursively splitting the training sample into smaller subsets. We give below a hig... | 1 |
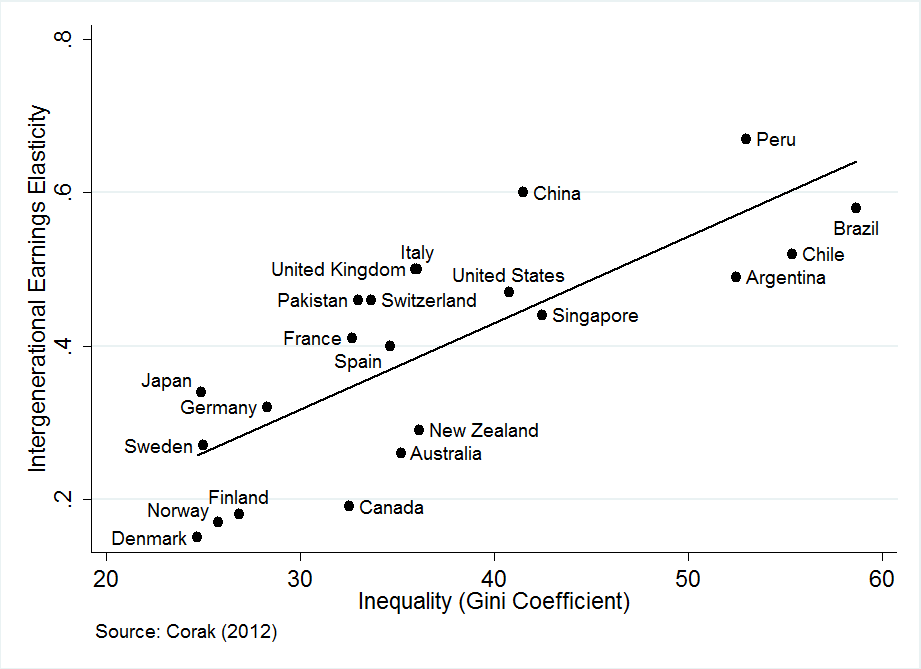
| 15:44, 16 July 2013 | 2012 Corak Gini-vs-IEE.png (file) |  |
41 KB | Gmelli | http://milescorak.com/2012/01/18/the-economics-of-the-great-gatsby-curve-a-picture-is-worth-a-thousand-words/ Gini Inequality Coefficient vs. Intergenerational Earnings Elasticity | 1 |