Entity-Relationship Digram (ERD) Model
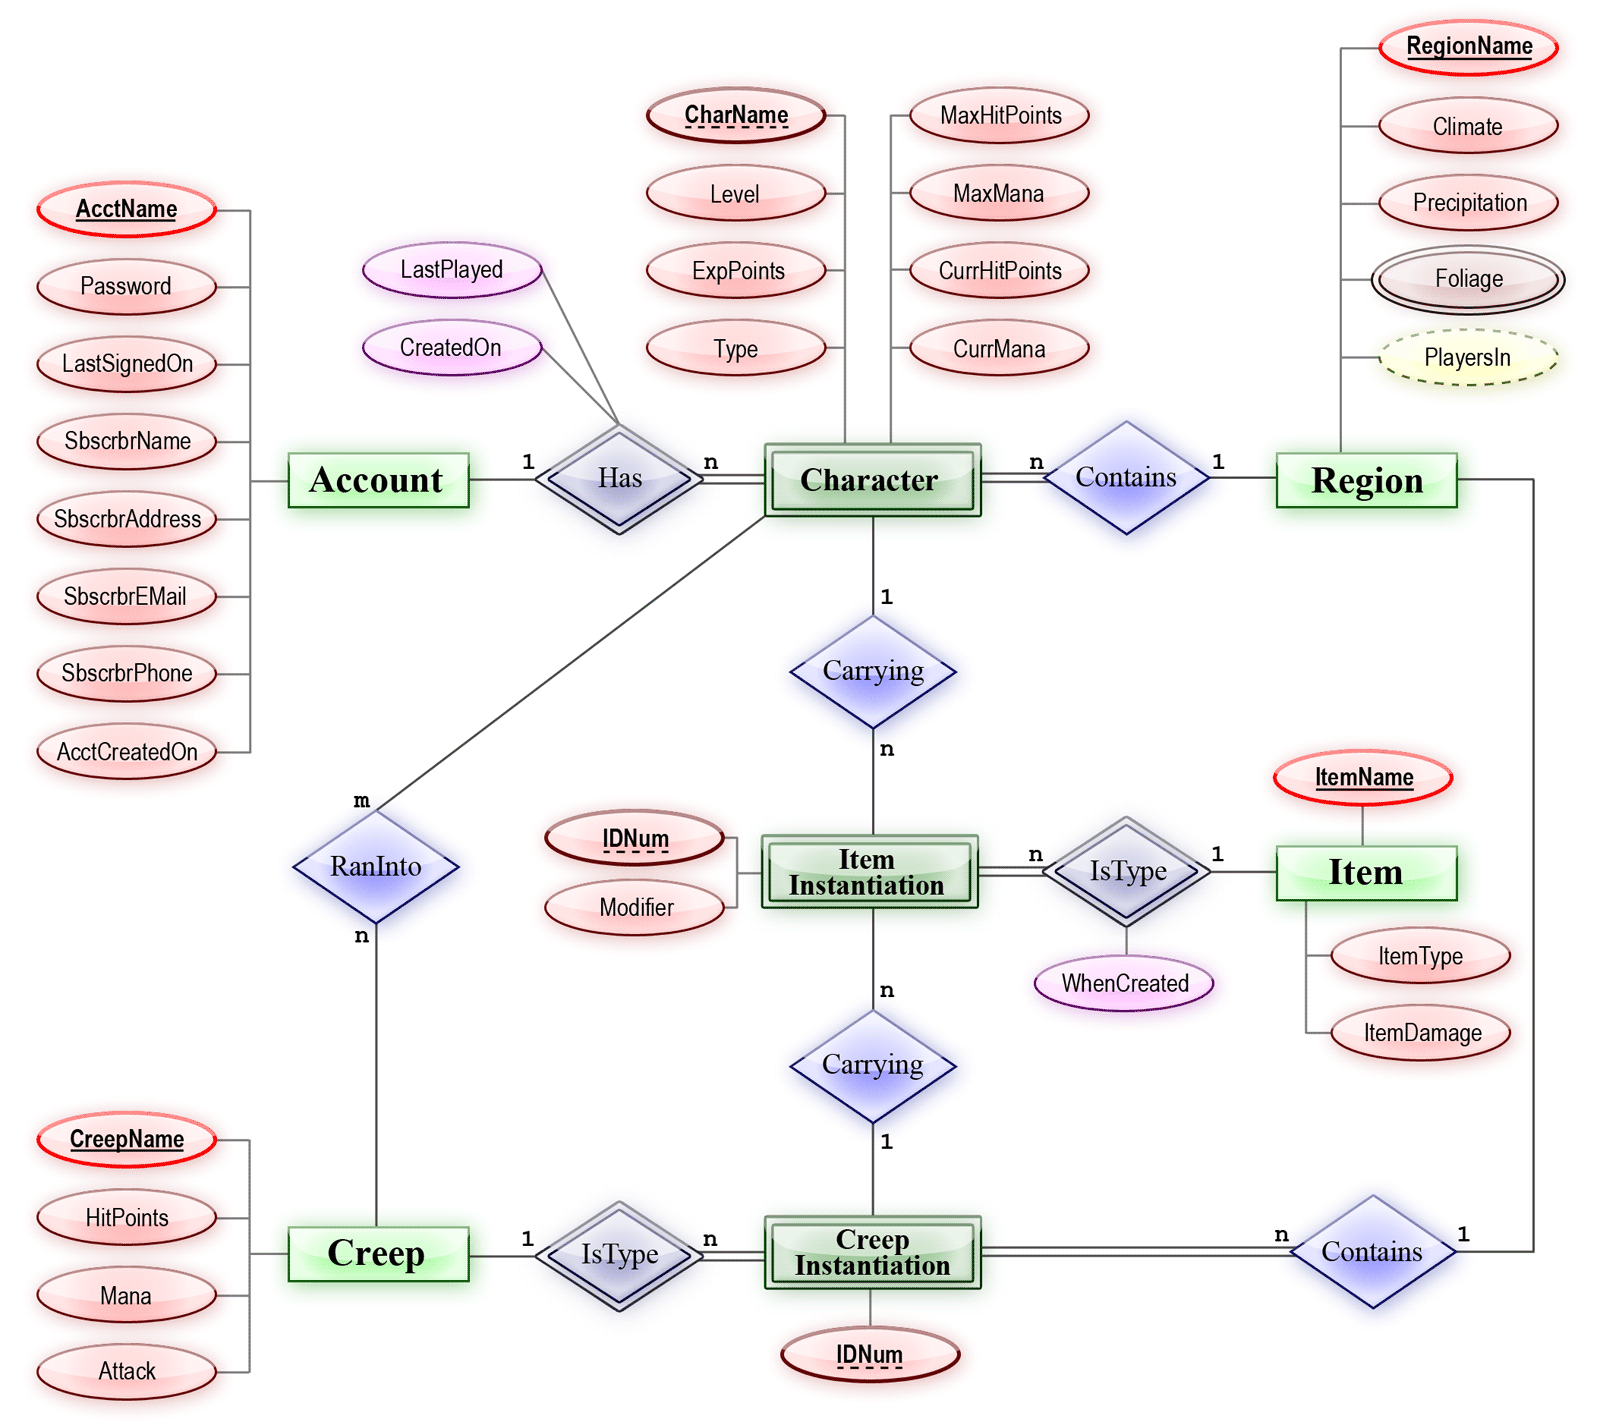
An Entity-Relationship Digram (ERD) Model is an visual design model that describes interrelated entities and relationships of interest (within a specific domain of knowledge).
- AKA: Entity–Relationship Model.
- Context:
- It can (typically) follow an Entity-Relationship Modeling Methodology.
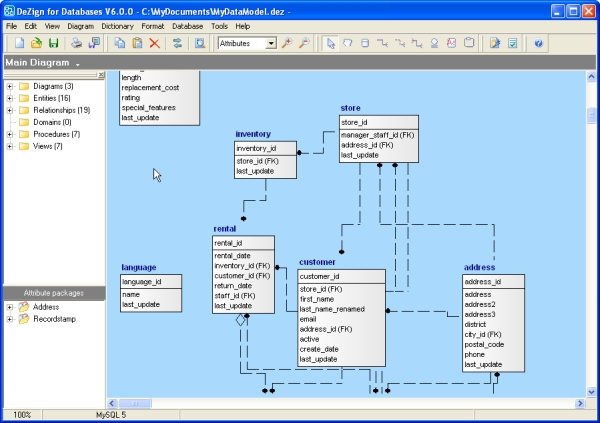
- It can be managed by an ERD Modeling System, such as LucidWorks for ERD [1].
- It can range from being a Conceptural ERD, Logical ERD, and Physical ERD, depending on its proximity to modeling a data base instance.
- …
- Example(s):
 .
. .
. .
.- …
- Counter-Example(s):
- a Class Diagram.
- an RDF-based Model.
- See: EAV Data Model, Data Modeling, Enterprise Data Model.
References
2023
- (Wikipedia, 2023) ⇒ https://en.wikipedia.org/wiki/Entity–relationship_model Retrieved:2023-8-25.
- An entity–relationship model (or ER model) describes interrelated things of interest in a specific domain of knowledge. A basic ER model is composed of entity types (which classify the things of interest) and specifies relationships that can exist between entities (instances of those entity types).
In software engineering, an ER model is commonly formed to represent things a business needs to remember in order to perform business processes. Consequently, the ER model becomes an abstract data model,that defines a data or information structure which can be implemented in a database, typically a relational database.
Entity–relationship modeling was developed for database and design by Peter Chen and published in a 1976 paper,[1] with variants of the idea existing previously, but today it is commonly used for teaching students the basics of data base structure. [2] Some ER models show super and subtype entities connected by generalization-specialization relationships, and an ER model can be used also in the specification of domain-specific ontologies.
- An entity–relationship model (or ER model) describes interrelated things of interest in a specific domain of knowledge. A basic ER model is composed of entity types (which classify the things of interest) and specifies relationships that can exist between entities (instances of those entity types).
- ↑ Chen, Peter (March 1976). “The Entity-Relationship Model - Toward a Unified View of Data". ACM Transactions on Database Systems. 1 (1): 9–36. CiteSeerX 10.1.1.523.6679. doi:10.1145/320434.320440. S2CID 52801746.
- ↑ A.P.G. Brown, "Modelling a Real-World System and Designing a Schema to Represent It", in Douque and Nijssen (eds.), Data Base Description, North-Holland, 1975, .