File:Kohonen 1982 Tab1.png

Original file (911 × 224 pixels, file size: 49 KB, MIME type: image/png)
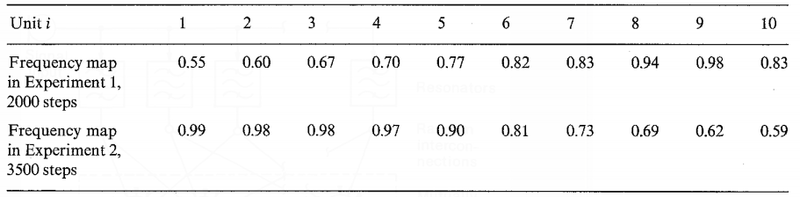
Table 1. Formation of frequency maps in Simulation 4. The resonators (20 in number) corresponded to second-order filters with quality factor Q=2.5 and resonant frequencies selected at random from the range [1,2]. The training frequencies were selected at random from the range [0.5; 1]. This table shows two different ordering results. The numbers in the table indicate those test frequencies to which each processing unit became most sensitive. In: Teuvo Kohonen (1982). "Self-Organized Formation of Topologically Correct Feature Maps" (PDF). Biological Cybernetics. 43 (1): 59–69. doi:10.1007/bf00337288
File history
Click on a date/time to view the file as it appeared at that time.
| Date/Time | Thumbnail | Dimensions | User | Comment | |
|---|---|---|---|---|---|
| current | 20:27, 22 July 2018 | 911 × 224 (49 KB) | Omoreira (talk | contribs) | '''Table 1'''. Formation of frequency maps in Simulation 4. The resonators (20 in number) corresponded to second-order filters with quality factor Q=2.5 and resonant frequencies selected at random from the range [1,2]. The [[Tra... |
You cannot overwrite this file.
File usage
The following page uses this file: