Prometheus Framework
A Prometheus Framework is an open-source timeseries DBMS, system monitoring framework and alerting framework.
- Context:
- It can (typically) enable high-dimensional data collection, storage, and analysis.
- It can (typically) be composed of Prometheus Components, such as:
- It can interoperate with a Thanos Framework for long-term storage.
- It can collect metrics using a pull-based model, retrieving data from instrumented services.
- It can provide real-time alerting capabilities to notify users of system anomalies.
- It can monitor various systems, from microservices to entire data centers.
- It can support various exporters that allow metrics collection from different systems and applications.
- It can scale horizontally for high availability and reliability.
- It can be used in Kubernetes environments to monitor containerized applications.
- ...
- …
- Example(s):
- Prometheus, v2.21.0 (~2020-08-27).
- …
- Counter-Example(s):
- Grafana Loki, which is a log aggregation system.
- Graphite Framework, which is a simpler time-series data logging and graphing tool.
- GCP Stackdriver, a commercial observability solution.
- OpenTelemetry, which is a more comprehensive observability framework.
- See: PromQL, Druid, Grafana, Kibana, Time Series Database, Event Monitoring, Alert Messaging, Dimension (Metadata), System Observability.
References
2020
- https://logz.io/blog/prometheus-vs-graphite/
- QUOTE: GraAlternatively, Prometheus and Graphite are open-source monitoring tools used to store and graph time series data. Prometheus is a “time series DBMS and monitoring system,” while Graphite is a simpler “data logging and graphing tool for time series data.” Both are open source and primarily used for system monitoring, yet Prometheus takes on additional tasks. In this article, we’ll pit Prometheus vs Graphite, side by side, mano a mano, and offer some criteria for choosing the right option.
One of the key performance indicators of any system, application, product, or process is how certain parameters or data points perform over time. What if you want to monitor hits on an API endpoint or database latency in seconds? A single data point captured in the present moment won’t tell you much by itself. However, tracking that same trend over time will tell you much more, including the impact of change on a particular metric.
If you want to know, for example, the impact a new community process or documentation has on the number of hits on your API, or how a specific software fix affected your database’s latency, comparing the present value to a previous one done before the change was introduced will be useful. Such is the value of time series data.
Monitoring tools built around time series data need to do the following under a very high transaction volume:
- Collect (or at least listen for) events, typically with a timestamp;
- Efficiently store these events at volume;
- Support queries of these events;
- Offer graphical monitoring of these capabilities so that trends can be followed over time.
- QUOTE: GraAlternatively, Prometheus and Graphite are open-source monitoring tools used to store and graph time series data. Prometheus is a “time series DBMS and monitoring system,” while Graphite is a simpler “data logging and graphing tool for time series data.” Both are open source and primarily used for system monitoring, yet Prometheus takes on additional tasks. In this article, we’ll pit Prometheus vs Graphite, side by side, mano a mano, and offer some criteria for choosing the right option.
2019
- (Wikipedia, 2019) ⇒ https://en.wikipedia.org/wiki/Prometheus_(software) Retrieved:2019-12-18.
- Prometheus is a free software application used for event monitoring and alerting. It records real-time metrics in a time series database (allowing for high dimensionality) built using a HTTP pull model, with flexible queries and real-time alerting. The project is written in Go and licensed under the Apache 2 License, with source code available on GitHub, and is a graduated project of the Cloud Native Computing Foundation, along with Kubernetes and Envoy.
2019
- https://opensource.com/article/19/11/introduction-monitoring-prometheus
- QUOTE: Metrics are the primary way to represent both the overall health of your system and any other specific information you consider important for monitoring and alerting or observability. Prometheus is a leading open source metric instrumentation, collection, and storage toolkit built at SoundCloud beginning in 2012. Since then, it's graduated from the Cloud Native Computing Foundation and become the de facto standard for Kubernetes monitoring. ...
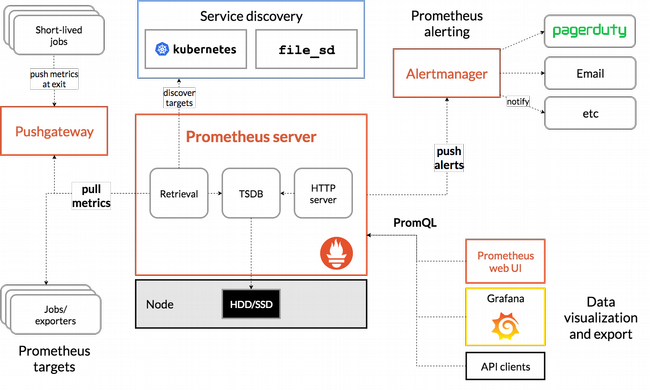
- For most use cases, you should understand three major components of Prometheus:
- The Prometheus server scrapes and stores metrics. Note that it uses a persistence layer, which is part of the server and not expressly mentioned in the documentation. Each node of the server is autonomous and does not rely on distributed storage. I'll revisit this later when looking to use a dedicated time-series database to store Prometheus data, rather than relying on the server itself.
- The web UI allows you to access, visualize, and chart the stored data. Prometheus provides its own UI, but you can also configure other visualization tools, like Grafana, to access the Prometheus server using PromQL (the Prometheus Query Language).
- Alertmanager sends alerts from client applications, especially the Prometheus server. It has advanced features for deduplicating, grouping, and routing alerts and can route through other services like PagerDuty and OpsGenie.
- QUOTE: Metrics are the primary way to represent both the overall health of your system and any other specific information you consider important for monitoring and alerting or observability. Prometheus is a leading open source metric instrumentation, collection, and storage toolkit built at SoundCloud beginning in 2012. Since then, it's graduated from the Cloud Native Computing Foundation and become the de facto standard for Kubernetes monitoring. ...