Python Matplotlib Library: Difference between revisions
m (Text replacement - "<P> [[" to "<P> [[") |
m (Text replacement - " [[" to " [[") |
||
| Line 24: | Line 24: | ||
=== 2021 === | === 2021 === | ||
* (Wikipedia, 2021) ⇒ https://en.wikipedia.org/wiki/Matplotlib Retrieved:2021-2-28. | * (Wikipedia, 2021) ⇒ https://en.wikipedia.org/wiki/Matplotlib Retrieved:2021-2-28. | ||
** '''Matplotlib''' is a [[Plotter|plotting]] [[Library (computer science)|library]] for the [[Python (programming language)|Python]] programming language and its numerical mathematics extension [[NumPy]]. It provides an [[Object-oriented programming|object-oriented]] [[API]] for embedding plots into applications using general-purpose [[GUI toolkit]]s like [[Tkinter]], [[wxPython]], [[Qt (software)|Qt]], or [[GTK+]]. There is also a [[Procedural programming|procedural]] "pylab" interface based on a [[state machine]] (like [[OpenGL]]), designed to closely resemble that of [[MATLAB]], though its use is discouraged. | ** '''Matplotlib''' is a [[Plotter|plotting]] [[Library (computer science)|library]] for the [[Python (programming language)|Python]] programming language and its numerical mathematics extension [[NumPy]]. It provides an [[Object-oriented programming|object-oriented]] [[API]] for embedding plots into applications using general-purpose [[GUI toolkit]]s like [[Tkinter]], [[wxPython]], [[Qt (software)|Qt]], or [[GTK+]]. There is also a [[Procedural programming|procedural]] "pylab" interface based on a [[state machine]] (like [[OpenGL]]), designed to closely resemble that of [[MATLAB]], though its use is discouraged. [[SciPy]] makes use of Matplotlib. Matplotlib was originally written by [[John D. Hunter]]. Since then it has an active development community and is distributed under a [[BSD licenses|BSD-style license]]. Michael Droettboom was nominated as matplotlib's lead developer shortly before John Hunter's death in August 2012 and was further joined by Thomas Caswell. Matplotlib 2.0.x supports Python versions 2.7 through 3.6. Python 3 support started with Matplotlib 1.2. Matplotlib 1.4 is the last version to support Python 2.6. Matplotlib has pledged not to support Python 2 past 2020 by signing the Python 3 Statement. | ||
=== 2017b === | === 2017b === | ||
Latest revision as of 17:07, 1 June 2024
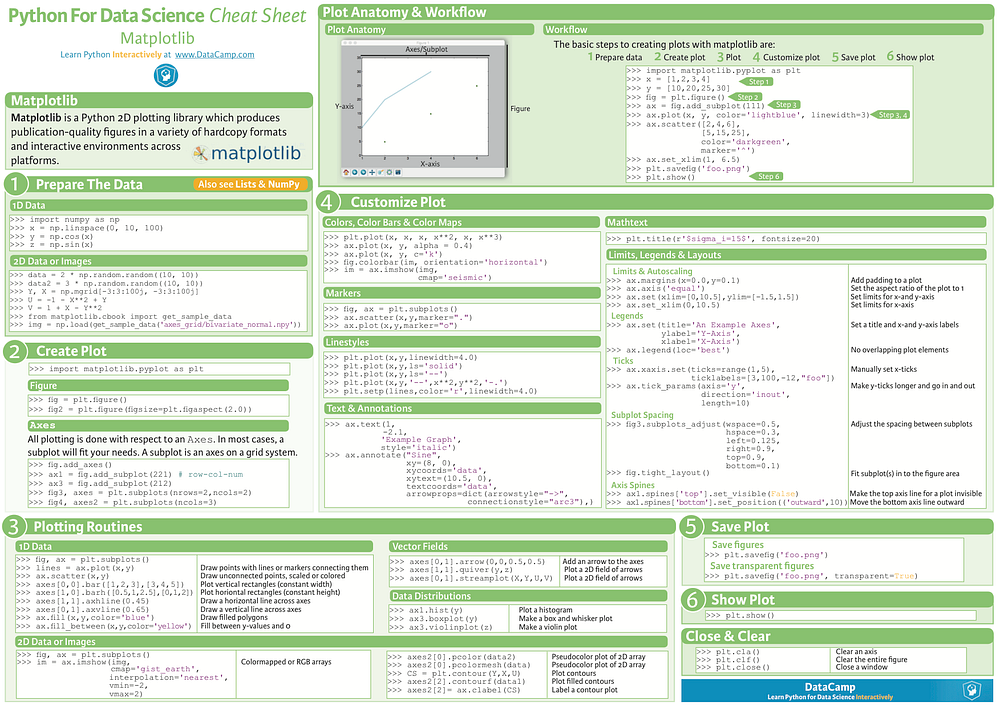
A Python Matplotlib Library is a Python that is plotting library for data visualization and 2D graphics .
- Context:
- Website: https://matplotlib.org
- Repository: https://github.com/matplotlib/matplotlib
- It can be intended to make publication quality plots using a syntax familiar to MATLAB users.
- It ranges from to being matplotlib v2.0.2 to being matplotlib v3.3.4.
- Example(s):
- Plotting a sine function in python using
matplotlib.pylabmodule:import numpy as npimport matplotlib.pyplot as plt
x = np.arange(0, 5, 0.1)
y = np.sin(x)
plt.plot(x, y)
- Matplotlib examples gallery:
- …
- Plotting a sine function in python using
- Counter-Example(s):
- See: Document Figure, Histogram, NumPy, Object-Oriented Programming, Qt (Framework), GNUplot, OpenGL.
References
2021
- (Wikipedia, 2021) ⇒ https://en.wikipedia.org/wiki/Matplotlib Retrieved:2021-2-28.
- Matplotlib is a plotting library for the Python programming language and its numerical mathematics extension NumPy. It provides an object-oriented API for embedding plots into applications using general-purpose GUI toolkits like Tkinter, wxPython, Qt, or GTK+. There is also a procedural "pylab" interface based on a state machine (like OpenGL), designed to closely resemble that of MATLAB, though its use is discouraged. SciPy makes use of Matplotlib. Matplotlib was originally written by John D. Hunter. Since then it has an active development community and is distributed under a BSD-style license. Michael Droettboom was nominated as matplotlib's lead developer shortly before John Hunter's death in August 2012 and was further joined by Thomas Caswell. Matplotlib 2.0.x supports Python versions 2.7 through 3.6. Python 3 support started with Matplotlib 1.2. Matplotlib 1.4 is the last version to support Python 2.6. Matplotlib has pledged not to support Python 2 past 2020 by signing the Python 3 Statement.
2017b
2017
- https://pypi.python.org/pypi/matplotlib/2.0.2
- QUOTE: matplotlib strives to produce publication quality 2D graphics for interactive graphing, scientific publishing, user interface development and web application servers targeting multiple user interfaces and hardcopy output formats. There is a ‘pylab’ mode which emulates matlab graphics.
2014
- (Wikipedia, 2014) ⇒ http://en.wikipedia.org/wiki/matplotlib Retrieved:2014-8-2.
- matplotlib is a plotting library for the Python programming language and its NumPy numerical mathematics extension. It provides an object-oriented API for embedding plots into applications using general-purpose GUI toolkits like wxPython, Qt, or GTK+. There is also a procedural "pylab" interface based on a state machine (like OpenGL), designed to closely resemble that of MATLAB. SciPy makes use of matplotlib.
matplotlib was originally written by John Hunter, has an active development community, and is distributed under a BSD-style license. Michael Droettboom was nominated as matplotlib's lead developer shortly before John Hunter's death in 2012. , matplotlib 1.3.1 supports Python versions 2.6 through 3.3. Matplotlib 1.2 is the first version of matplotlib to support Python 3.x.
- matplotlib is a plotting library for the Python programming language and its NumPy numerical mathematics extension. It provides an object-oriented API for embedding plots into applications using general-purpose GUI toolkits like wxPython, Qt, or GTK+. There is also a procedural "pylab" interface based on a state machine (like OpenGL), designed to closely resemble that of MATLAB. SciPy makes use of matplotlib.
2014
- http://sourceforge.net/projects/matplotlib/
- QUOTE: Matplotlib is a python library for making publication quality plots using a syntax familiar to MATLAB users. Matplotlib uses numpy for numerics. Output formats include PDF, Postscript, SVG, and PNG, as well as screen display.
2014
- http://matplotlib.org/
- QUOTE: matplotlib is a python 2D plotting library which produces publication quality figures in a variety of hardcopy formats and interactive environments across platforms. matplotlib can be used in python scripts, the python and ipython shell (ala MATLAB®* or Mathematica®†), web application servers, and six graphical user interface toolkits.
matplotlib tries to make easy things easy and hard things possible. You can generate plots, histograms, power spectra, bar charts, errorcharts, scatterplots, etc, with just a few lines of code.
- QUOTE: matplotlib is a python 2D plotting library which produces publication quality figures in a variety of hardcopy formats and interactive environments across platforms. matplotlib can be used in python scripts, the python and ipython shell (ala MATLAB®* or Mathematica®†), web application servers, and six graphical user interface toolkits.