Government Bonds-based Yield Curve
A Government Bonds-based Yield Curve is a graphical plot of bond yields for bomds with equal credit quality but differing maturity dates.
- Context:
- It can range from being a Typical Yield Curve to being an Inverted Yield Curve.
- …
- Example(s):
- A U.S. Treasury Bond Yield Curve.
- one that includes 2-year Treasury Yields, and 10-year Treasury Yield, and ...
- See: Bond Market, Interest Rate, Maturity (Finance), United States Treasury Security, Term Structure of Interest Rates, Yield (Finance).
References
2018
- (Wikipedia, 2018) ⇒ https://en.wikipedia.org/wiki/yield_curve Retrieved:2018-4-23.
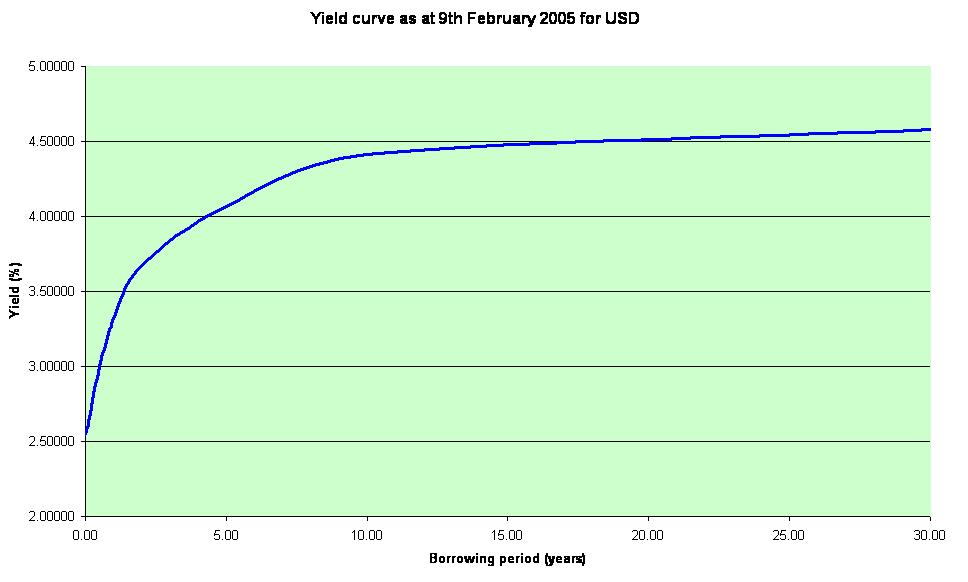
- In finance, the yield curve is a curve showing several yields or interest rates across different contract lengths (2 month, 2 year, 20 year, etc. ...) for a similar debt contract. The curve shows the relation between the (level of the) interest rate (or cost of borrowing) and the time to maturity, known as the "term", of the debt for a given borrower in a given currency. For example, the U.S. dollar interest rates paid on U.S. Treasury securities for various maturities are closely watched by many traders, and are commonly plotted on a graph such as the one on the right which is informally called "the yield curve". More formal mathematical descriptions of this relation are often called the term structure of interest rates.
The shape of the yield curve indicates the cumulative priorities of all lenders relative to a particular borrower (such as the US Treasury or the Treasury of Japan), or the priorities of a single lender relative to all possible borrowers. With other factors held equal, lenders will prefer to have funds at their disposal, rather than at the disposal of a third party. The interest rate is the "price" paid to convince them to lend. As the term of the loan increases, lenders demand an increase in the interest received. In addition, lenders may be concerned about future circumstances, e.g. a potential default (or rising rates of inflation), so they demand higher interest rates on long-term loans than they demand on shorter-term loans to compensate for the increased risk. Occasionally, when lenders are seeking long-term debt contracts more aggressively than short-term debt contracts, the yield curve "inverts", with interest rates (yields) being lower for the longer periods of repayment so that lenders can attract long-term borrowing.
The yield of a debt instrument is the overall rate of return available on the investment. In general the percentage per year that can be earned is dependent on the length of time that the money is invested. For example, a bank may offer a "savings rate" higher than the normal checking account rate if the customer is prepared to leave money untouched for five years. Investing for a period of time t gives a yield Y(t).
This function Y is called the yield curve, and it is often, but not always, an increasing function of t. Yield curves are used by fixed income analysts, who analyze bonds and related securities, to understand conditions in financial markets and to seek trading opportunities. Economists use the curves to understand economic conditions.
The yield curve function Y is actually only known with certainty for a few specific maturity dates, while the other maturities are calculated by interpolation (see [[#Construction of the full yield curve from market data|Construction of the full yield curve from market data]] below).
- In finance, the yield curve is a curve showing several yields or interest rates across different contract lengths (2 month, 2 year, 20 year, etc. ...) for a similar debt contract. The curve shows the relation between the (level of the) interest rate (or cost of borrowing) and the time to maturity, known as the "term", of the debt for a given borrower in a given currency. For example, the U.S. dollar interest rates paid on U.S. Treasury securities for various maturities are closely watched by many traders, and are commonly plotted on a graph such as the one on the right which is informally called "the yield curve". More formal mathematical descriptions of this relation are often called the term structure of interest rates.
2018
- https://www.schwab.com/resource-center/insights/content/dont-fear-yield-curve-reaper
- QUOTE: ... The yield curve is a graphical plot of the yields of bonds with different maturities; and the aforementioned “10s-2s” spread is one of the more commonly-tracked. In a normal economic/market environment, the curve is generally upward-sloping as yields on longer-term bonds are typically higher than shorter-term bonds, because the former are higher-risk investments due to their duration.
An inverted yield curve occurs when shorter-term rates are above longer-term rates. This happens when the Fed hikes the fed funds rate to beyond the yield of longer-term Treasury securities; and has been a fairly accurate recession signal historically, albeit with a lag. ...

- QUOTE: ... The yield curve is a graphical plot of the yields of bonds with different maturities; and the aforementioned “10s-2s” spread is one of the more commonly-tracked. In a normal economic/market environment, the curve is generally upward-sloping as yields on longer-term bonds are typically higher than shorter-term bonds, because the former are higher-risk investments due to their duration.
2017
- https://www.investopedia.com/terms/y/yieldcurve.asp
- QUOTE: A yield curve is a line that plots the interest rates, at a set point in time, of bonds having equal credit quality but differing maturity dates. The most frequently reported yield curve compares the three-month, two-year, five-year and 30-year U.S. Treasury debt. This yield curve is used as a benchmark for other debt in the market, such as mortgage rates or bank lending rates, and it is also used to predict changes in economic output and growth. …
2014
- (Wikipedia, 2014) ⇒ http://en.wikipedia.org/wiki/bond_market Retrieved:2014-6-22.
- … An important part of the bond market is the government bond market, because of its size and liquidity. Government bonds are often used to compare other bonds to measure credit risk. Because of the inverse relationship between bond valuation and interest rates, the bond market is often used to indicate changes in interest rates or the shape of the yield curve. The yield curve is the measure of "cost of funding".